DOCUMENTATION · FIELD NOTES
How to use the LLM Probe
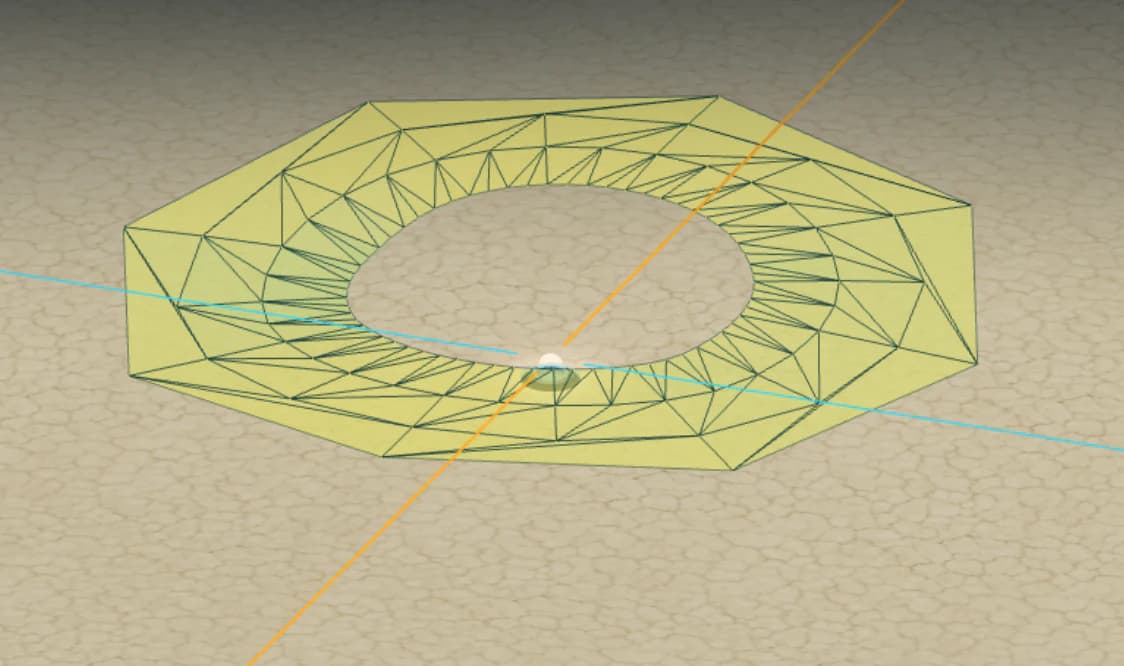
The LLM Probe explores pre-collected perturbations around prompt-conditioned activations in Gemma 2. It is an empirical visualization: displayed nodes correspond to model measurements, while connecting faces make the sampling topology legible.
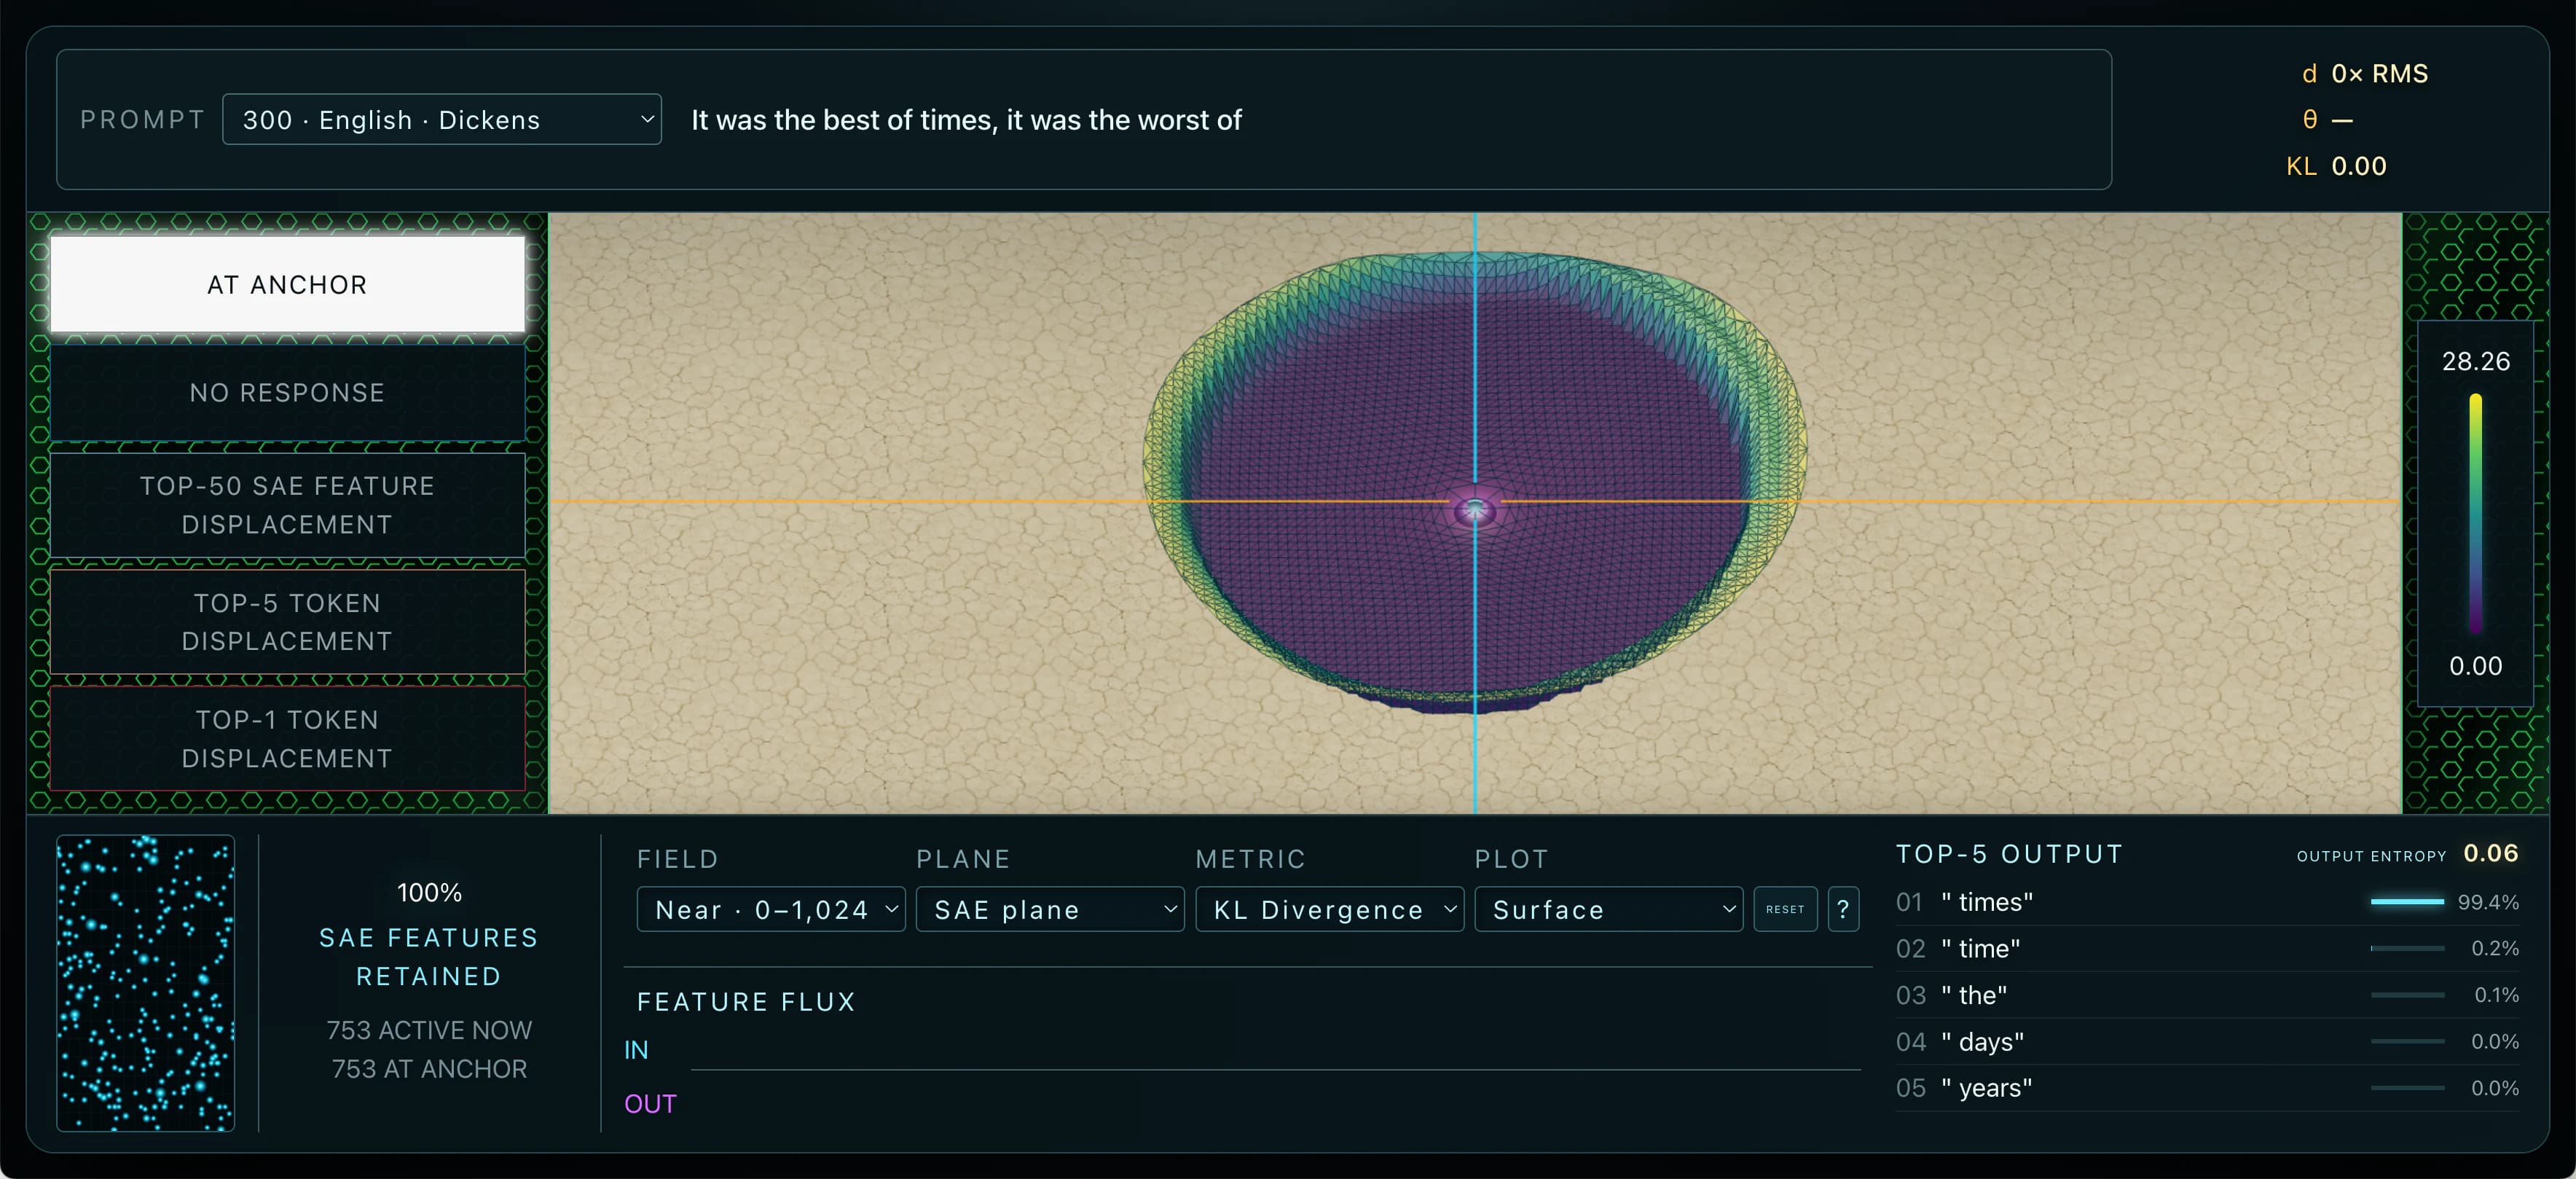
Experimental path
A prompt determines the anchor activation. The probe adds a controlled displacement in a selected plane.
The Layer-14 activation is encoded by its SAE to obtain active feature identities and magnitudes.
The normal language-model output supplies token probabilities, entropy and KL divergence.
These are separate observers. Layer 14 supplies the SAE feature response; token statistics come from Gemma’s ordinary final logits after all remaining layers. No Layer-14 logit lens is used.
Instrument anatomy
The display has three working zones. The prompt and probe coordinates sit above the terrain. The terrain itself is the spatial workspace. The lower console selects the dataset and reports feature and token responses.
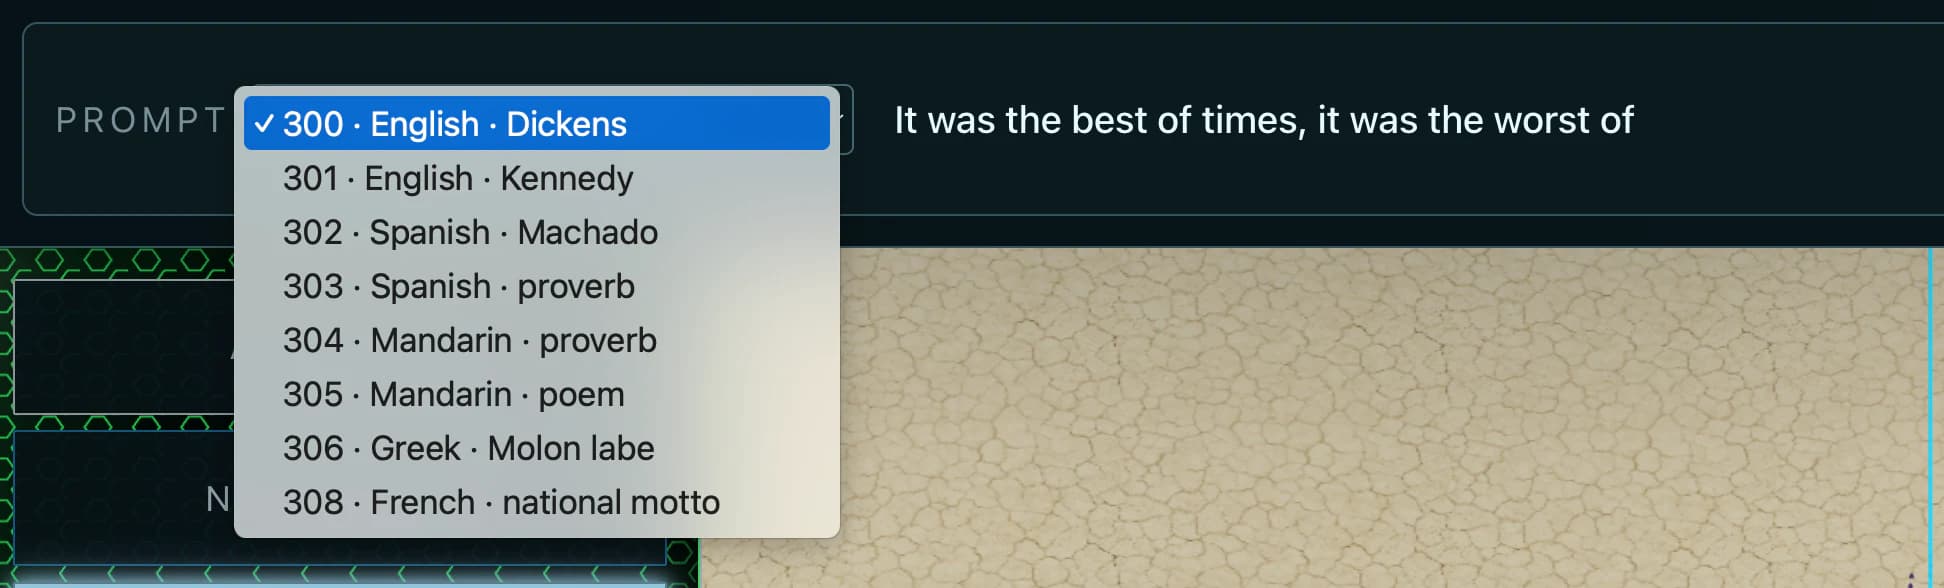
Selects one pre-collected prompt and displays its text, distance, direction and current metric.
Shows the selected two-dimensional activation-space slice in Explore or Surface mode.
Reports the strongest observed categorical displacement at the current probe location.
Selects field, plane, metric and plot mode while reporting SAE and token responses.
Your first exploration
- Choose a prompt.The anchor, baseline tokens and all displayed measurements change together.
- Start in the near field.Select the SAE plane, KL divergence and Explore.
- Click once to enable the probe.Move outward from the anchor and watch the response-status instrument.
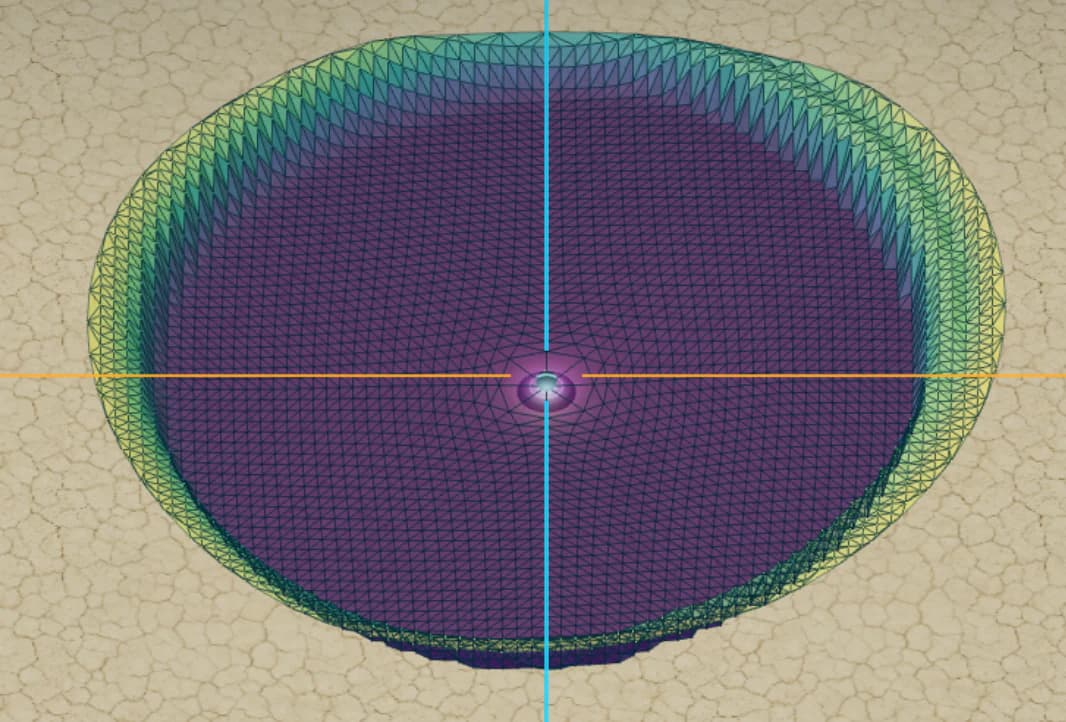
- Switch to Surface.Rotate the completed measured surface and inspect its basin.
Reading the terrain
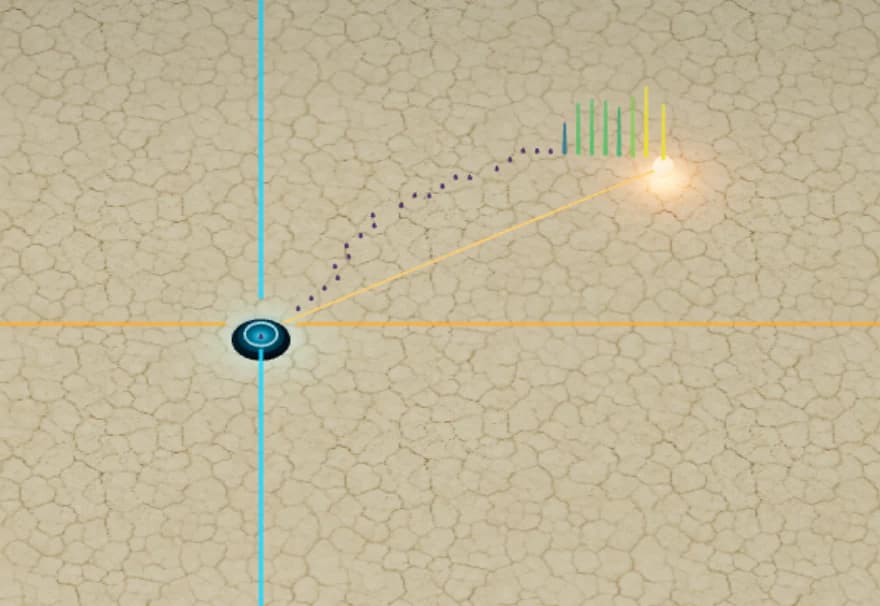
The anchor is the activation produced by the selected prompt. The two colored axes span the displayed plane.
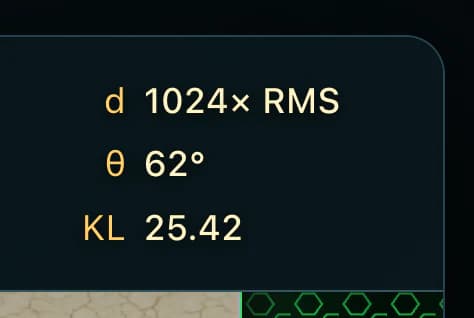
The readout gives three coordinates at the probe: d is distance from the anchor in multiples of the anchor RMS; θ is direction in the displayed plane; the third line is the value of the currently selected metric.
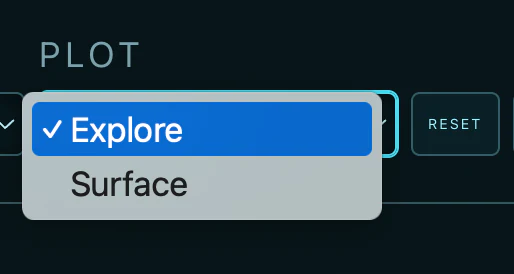
The terrain begins substantially unmarked. Moving the probe reveals individual measured locations and leaves a persistent trail. This mode supports guided discovery during a presentation.
All sampled nodes and declared connections are shown at once. Rotate and zoom this completed measurement mesh to inspect basin shape, asymmetry and large-scale structure.
Response status
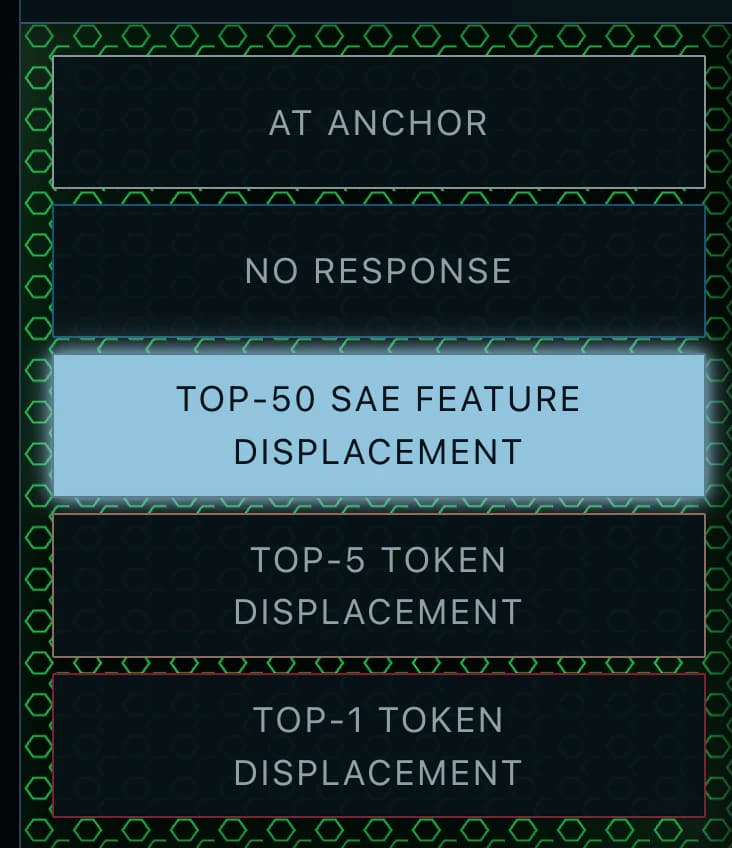
The five-part instrument at the left reports categorical changes at the current probe location. Only one state is illuminated at a time.
- At anchor
- The probe is at the prompt-conditioned Layer-10 activation.
- No response
- The measured Top-50 SAE feature identities and Top-5 token identities remain unchanged.
- Top-50 SAE feature displacement
- The Top-50 SAE feature set has reorganized while the Top-5 tokens remain in place.
- Top-5 token displacement
- At least one Top-5 token or its ordering has changed, but Top-1 is retained.
- Top-1 token displacement
- The most likely token differs from the anchor readout.
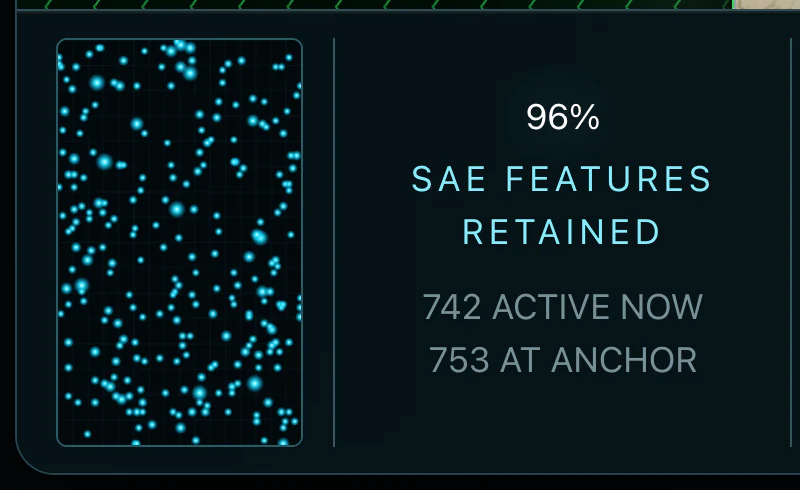
SAE feature displacement monitor
The percentage reports how many SAE features active at the anchor remain active at the probe. The two counts show total active features now and at the anchor; they need not move in the same proportion. The address field renders the 256 strongest currently active features, with marker size reflecting activation magnitude.
Metrics
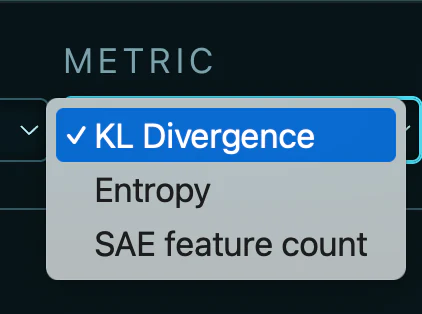
- KL divergence
- Difference between the model’s final-output token distribution at the probe and at the anchor.
- Entropy
- Uncertainty of the complete final-output token distribution, reported in nats.
- SAE feature count
- Number of non-zero features in the Layer-14 SAE readout.
In Surface mode, marker height and Viridis color encode the selected metric together. The vertical key at the right reports the active range. Changing the metric does not move the sampled coordinates; it changes the measured quantity projected onto height and color.
Emphasizes how far the complete final-output token distribution has moved from the prompt-conditioned anchor.
Shows where the final output becomes more or less uncertain, independently of which tokens changed.
Shows expansion or contraction in the number of non-zero Layer-14 SAE features.
Final-output token readout
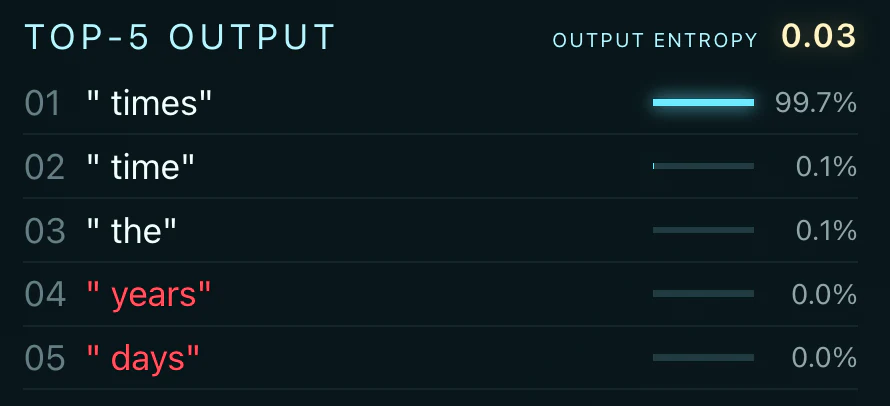
The Top-5 list ranks the most probable next tokens at the current probe location. The bars and percentages are obtained by applying a full-vocabulary softmax to Gemma’s ordinary final logits—not by unembedding Layer 14. A token is red when its identity or rank differs from the anchor baseline. Output entropy summarizes uncertainty across the complete final-output distribution, not merely these five entries.
Planes
The plane selector changes the two directions spanning the displayed activation-space slice. The prompt-conditioned anchor stays fixed, but each choice exposes different surrounding geometry.
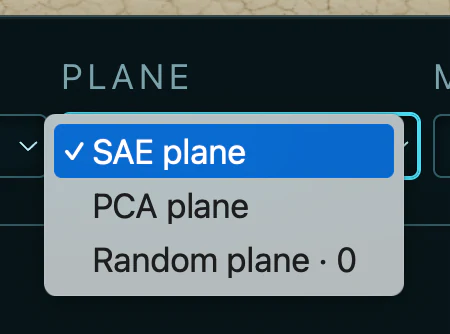
Spans the two selected SAE feature directions. This is the feature-informed plane used for the primary expedition.
Spans principal directions estimated from activation data, emphasizing directions of observed variance.
Provides a seeded comparison not chosen for SAE structure or explained variance.
Near and far fields
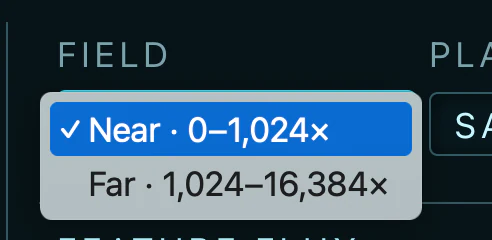
The near field covers 0–1,024× RMS and resolves the prompt-conditioned basin. The far field covers 1,024–16,384× RMS and surveys large-scale geometry using a separate visual radial scale. The selector prevents those two scales from being mistaken for a single linear map.
Mouse and keyboard

Data provenance
All model outputs are pre-collected. The public site does not run Gemma in the browser. Each prompt, plane and field loads a persisted measurement cartridge containing coordinates, token readouts, entropy, KL divergence and SAE feature data.
Limitations
- The view is a two-dimensional slice through a much higher-dimensional activation space.
- Plane choice changes the terrain being observed.
- Token identity can overstate semantic displacement across equivalent spellings, scripts or tokenizations.
- Rendered surfaces connect samples for visualization; only nodes are direct measurements.
- Results are prompt-conditioned and should not be generalized to all activations without further experiments.